


Buckle up, everyone. We’re going back to high school economics class for a hot minute to witness a little supply-and-demand MAGIC. Remember watching your teacher draw endless variations of those graphs on the chalkboard (or whiteboard for you fancy millennials)?
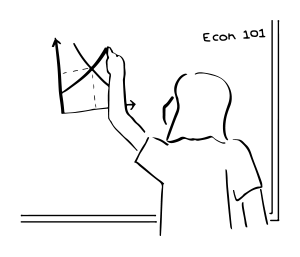
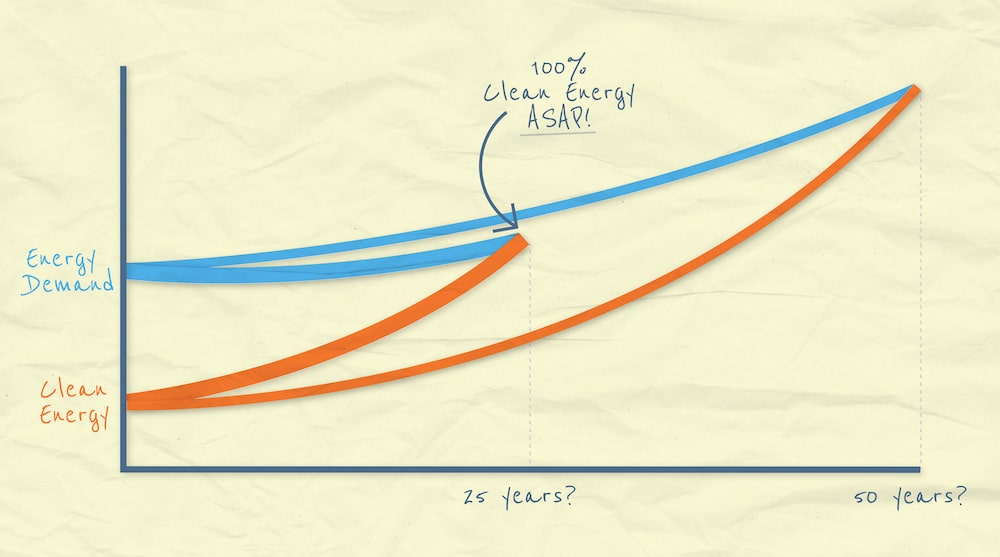
Why are we headed back to high school econ? Every once in a while, it’s helpful to zoom out and remind ourselves what all this effort behind wind and solar energy, electric vehicles, global politics, electrification, and more is all driving toward. The end goal of our energy transition is to fully power our world with clean, renewable energy. Put another way, we want to arrive at the point when our supply of clean energy completely matches our demand for energy.
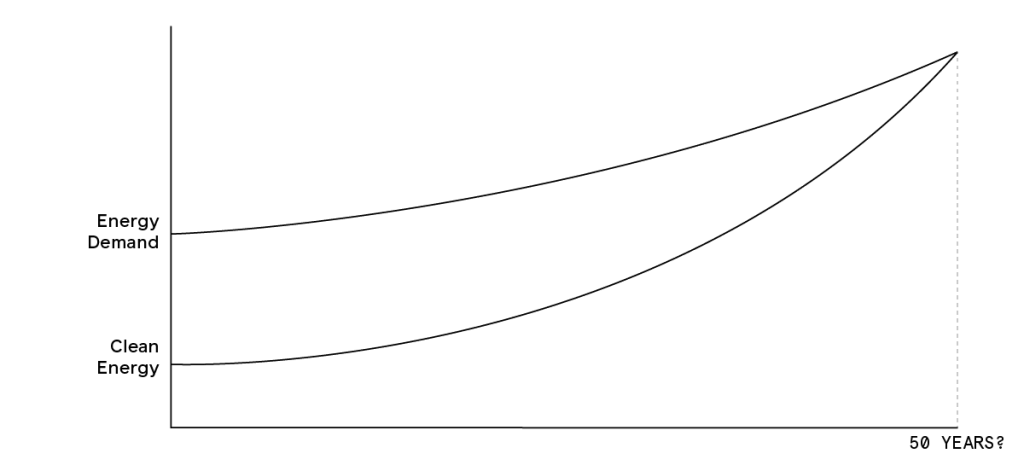
Here’s the takeaway, though, class: we need that glorious day—when the supply curve meets the demand curve—to arrive as soon as possible. In the context of the climate crisis, getting there a decade earlier, for example, makes a world of difference (pun very much intended).
How do we make this 100% clean energy moment arrive as soon as possible? We need to bend the curves. If we slow down the growth of energy demand (bend the curve down) and speed up the growth of clean energy supply (bend the curve up), the chart does something kinda magical: it makes the 100% clean energy moment arrive much more quickly than you might expect.
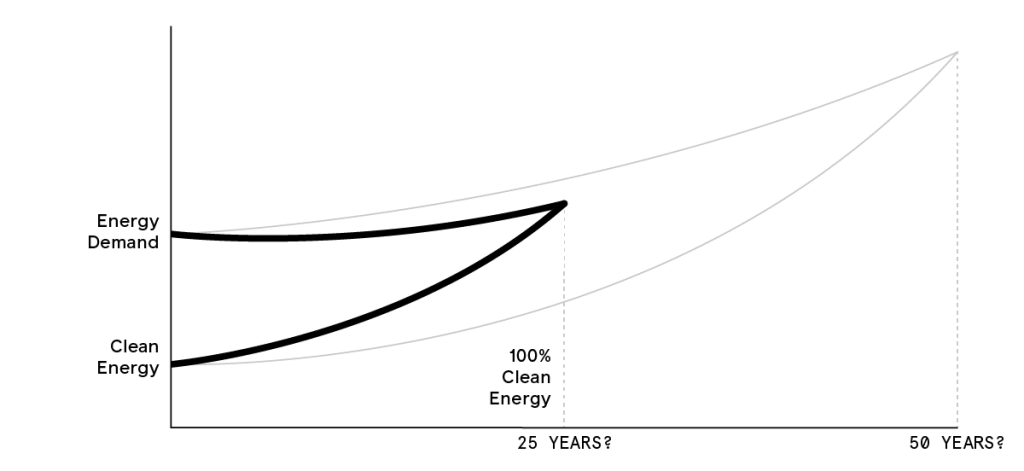
Whammo. That’s some econ magic, y’all. So how exactly do we bend those curves?
Another (more colorful) way to visualize things
In order to answer that important question, let’s look at another visualization of our energy supply and demand—this one with a bit more detail. This chart shows where our energy comes from (on the left), and to what end uses it flows (on the right). The specifics won’t be on the test, but the gist is that supply is on the left and demand is on the right:
-
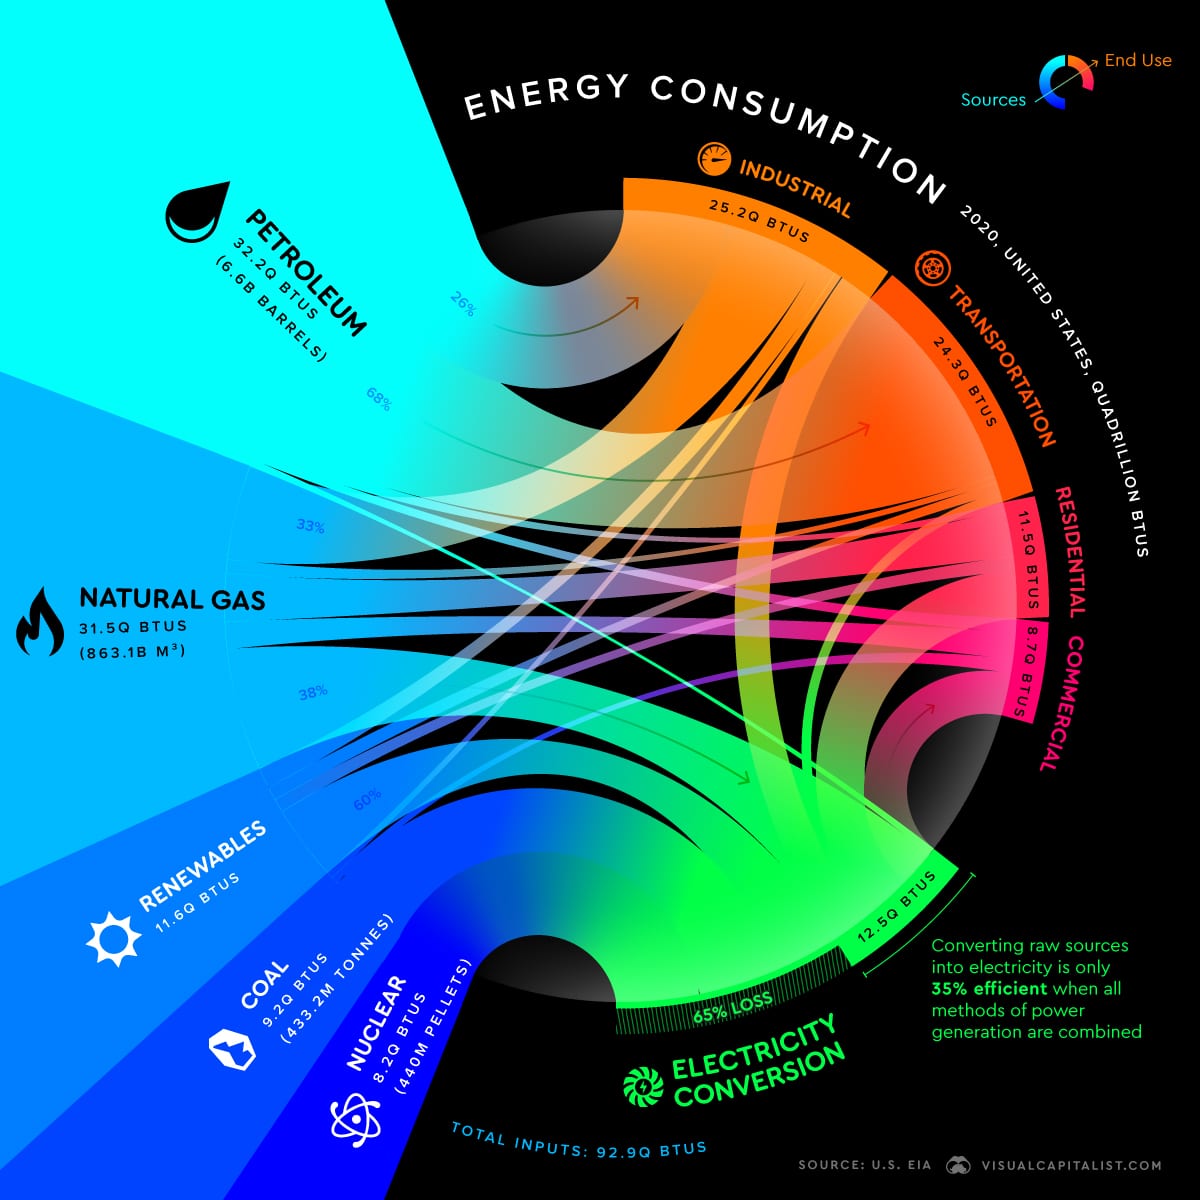
Breaking down America’s energy sources and consumption in 2020. Credit: Visual Capitalist
After you’ve had a minute let this rainbow of colors soak in, we’re ready to answer our key questions: how do we bend those supply and demand curves?
How to bend the supply curve up
How do we accelerate the growth rate of renewable energy? While the chart above is fascinating to look at, it’s also alarming to see the amount of petroleum and natural gas on which we still rely. The important reminder here is that this snapshot in time doesn’t show the growth curve renewables are on over time. They’ve had remarkable growth over the past decade—and they’re just getting started. Here are three key ways to bend the clean, renewable energy supply curve (i.e., accelerate growth) even more:
- Set a clean electricity standard: While some state governments have set their own standards (requiring utilities to get a certain percentage of their electricity from renewable sources), the climate crisis now demands a more aggressive timeline. The federal government could weigh in with a national standard in order to speed up growth of renewable energy, using a variety of carrots and sticks to urge utilities to pick up their pace. In fact, such a standard should be included in the reconciliation bill currently being discussed on Capitol Hill—and it’s likely Congress’ last good chance to implement this critical policy.
- Stop subsidizing fossil fuels: Despite what the coal, oil, and gas industries (and their entourage of politicians) would have us think, most Americans would be shocked at how much we prop up fossil fuels versus renewables. We’re talking over $35 billion in direct and consumption subsidies and nearly $700 billion in “implicit” subsidies (the costs to the U.S. government from climate change, air pollution, and infrastructure damage that fossil fuels aren’t paying) every year. If we turned off this spigot and directed even a fraction of that money toward deploying renewable energy, we could bend that growth curve up dramatically.
- Electrify everything: Look back at the colorful chart: if more of our end uses on the right (e.g., “Transportation,” “Residential,” “Commercial”) were able to run on electricity instead of on oil and gas, it would drive more growth of renewables (which can generate electricity very cost-effectively) and less production of fossil fuels. What’s that cool word for making things “be able to run on electricity”? Electrification. Think switching from gas-powered cars, trucks, buses, machinery, appliances, and HVAC to electric versions.
How to bend the demand curve down
Now that we’ve covered how to bend the supply curve up, let’s turn our attention to the less-sexy job of bending the demand curve down—i.e., reducing our demand for energy. Using less (of anything) doesn’t quite capture the American public’s imagination like building massive wind turbines does, but the good news is that reducing demand can be an incredibly cost-efficient way of saving money, lowering emissions, and hastening the arrival of our 100% clean energy moment—all without hampering economic growth (California is a successful example of this). Here are three key ways to bend the demand curve down:
-
- Make our buildings more energy efficient: This report summarizes it best: “Architectural designs, construction practices, and technologies are available today that minimize energy and resource use in buildings and optimize the benefits to people of high performance—cleaner air, more comfortable homes and workspaces, and lower utility bills. And improved building efficiency is a win for city leaders and local planners: every $1 invested in efficiency saves $2 in new power plants and electricity distribution costs.”
- Change our most energy-intensive behaviors: Certain individual behaviors require a ton of energy to make happen, and doing less of them would go a long way toward reducing energy demand. Behaviors like reducing food waste, eating less meat, and flying less are both energy- and carbon-intensive—even though all the energy input is sometimes hidden from consumers’ view (“embedded”).
- Electrify everything: Same idea as mentioned above, but for a different reason here: electric motors are simply far more efficient machines than their fossil fuel-powered counterparts. Switching from a gas furnace to a heat pump can reduce a home’s electricity use for heating by 50%; electric vehicle powertrains are 3-6x more efficient than comparable gas-powered powertrains. Electric machines aren’t just better for pollution and the climate crisis—they’re now simply better.
The result
If we’re able to bend the growth curves of both supply and demand, we can accelerate the arrival of a world fully powered by clean, renewable energy. And in case you needed a reminder, speed is of the essence. Every little bit of acceleration matters, as climate scientist Allison Crimmins reminded us just a few weeks ago: “…Every action counts to avoid those [climate] impacts. So every bit of temperature, every tenth of a degree that we can avoid is going to be better. Every single action matters. Every year matters.”